Can AI Reliably Estimate Macros from Photos?
Written in October 2026
Nowadays, for different reasons, some people choose to track their intake. This is particularly prevalent amongst fitness enthusiasts, but there are also health reasons for it. As somebody who has tracked his intake accurately for quite a while, I know that it can be limiting at times. It can be annoying. It’s always a lot of work.
One of the obvious shortcuts would be to take a picture of your food, have AI estimate what’s in it, and say an estimate is surely better than nothing. Today we have general-purpose models, so we don’t need to create huge training datasets. A smaller dataset is enough for an evaluation. That’s exactly what I figured I should do, simply because I have all the data already.
Background
Over the past years I have built a number of side projects that I use to understand and track my nutrition. One of them is a backend that gives me, for any food, be it a branded product or a foundational food such as apples, the nutrients in one consistent format. I had two major motivations for building my own. The common one: the data out there that I found was very noisy, and consistency was lacking. The other: fiber was often not available, and I wanted to explore ways of imputing it. In the European Union, manufacturers are required to print nutrition information on most foods, but they are not required to put fiber on there. And fiber is a very important part of nutrition.
Once the backend was good enough, I was still tracking with proprietary apps that I found so very lacking. I would diligently weigh things, but too often when I checked, the numbers in their databases, if they had any for a product I’d scanned, were completely incorrect. Often you could check that very easily, because some values were absurdly high: off by an order of magnitude or several, because something given in milligrams was entered into the database as grams. So I also built my own app. I have been using it since February on my Android phone, and it’s a fully fledged nutrition tracker. It’s one of the more insane side projects of mine, by sheer scope and size and effort.
So I have tracked very accurately for a long time, and more often than not I have also taken photographs of my meals. It’s data, and photos are part of that data.
The experiment
With all this, I sat down and did a bit of data cleanup and aggregation. For a quick start I took 32 recent meals, from September and October 2026, where I have a photo and where I weighed everything that went in. I left out a few whose photos were bad.
Mostly I want to compare how much is actually in the food with what the AI estimates. I used Claude Sonnet 5.5 and gave it the photo only. To be fair to the AI, there are two different ways of doing this. One is you give the AI the photo and have it figure it out by itself (AI alone, in Figure 1). I think this is what a lot of people would do if they snapped a picture and put it into ChatGPT or whatever app they use. The other, which I believe proprietary tracking apps often do, is to have the AI name the foods and their weights, and look up the nutrients in a food database (AI with food database). Because I have my own food database, I can do that too. So we can compare these two conditions against the ground truth: the values we actually have for the food.
The caveat is, of course, that any and all nutritional values are approximations. The US food database, FoodData Central, publishes the individual lab samples behind some of its foods. For Roma tomatoes it lists eight, bought in Virginia and Maryland in 2020 and 2021. Per 100 g, protein ranges from 0.56 to 0.88 g and fiber from 0.76 to 1.24 g. For produce it matters which variety you plant, and for minerals it can also make a huge difference what soil you grow it in, which makes sense to most people: minerals have to come from somewhere, and that’s the ground. Brazil nuts range from 136 to 2,740 µg of selenium per 100 g, while their protein stays between 13.9 and 14.8 g.
Results
Mean error 152 kcal · average −101 kcal · 38 % within ±20 %
| Per meal | Mean error | Average bias | Within ±20 % |
|---|---|---|---|
| Energy | |||
| AI alone | 152 kcal | −101 kcal | 38 % |
| AI with food database | 159 kcal | −125 kcal | 41 % |
| No photo | 197 kcal | +41 kcal | 41 % |
| Protein | |||
| AI alone | 17.9 g | −17.0 g | 22 % |
| AI with food database | 17.9 g | −16.7 g | 16 % |
| No photo | 20.2 g | +1.1 g | 9 % |
| Fiber | |||
| AI alone | 5.1 g | −4.7 g | 19 % |
| AI with food database | 4.4 g | −2.9 g | 34 % |
| No photo | 6.5 g | +0.2 g | 31 % |
Table 1. Error per meal over the 32 meals. The no-photo row is a guess that never looks at the meal: for each meal, it takes the median of the other 31.
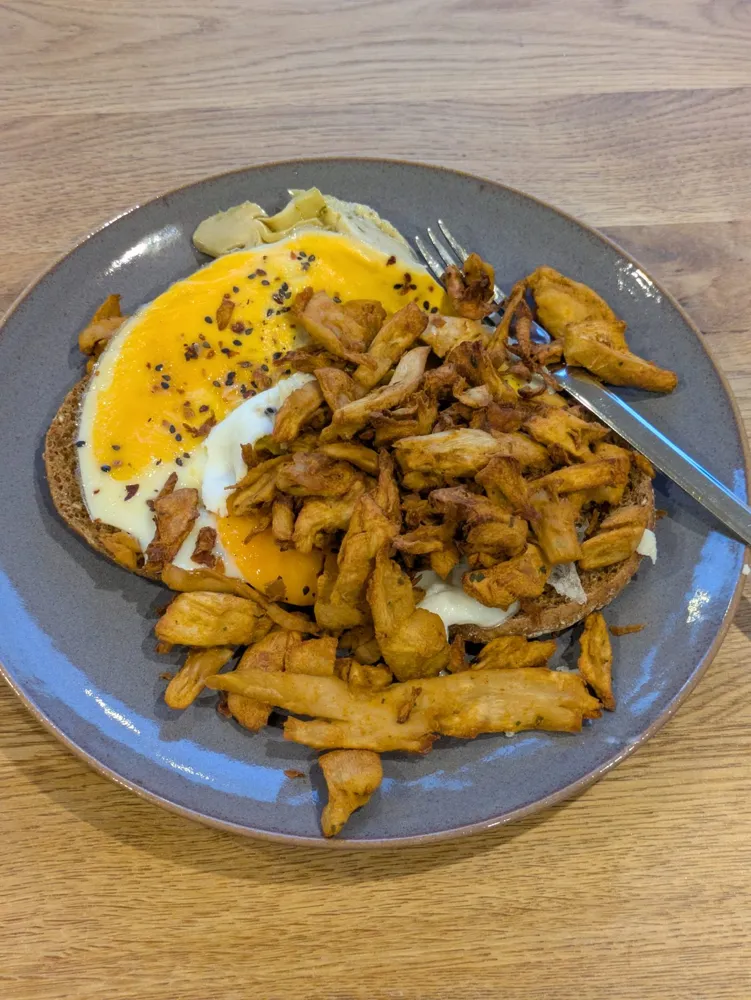
Logged 650 kcal and 54 g protein. AI alone: 650 kcal, 50 g. AI with food database: 585 kcal, 55 g.
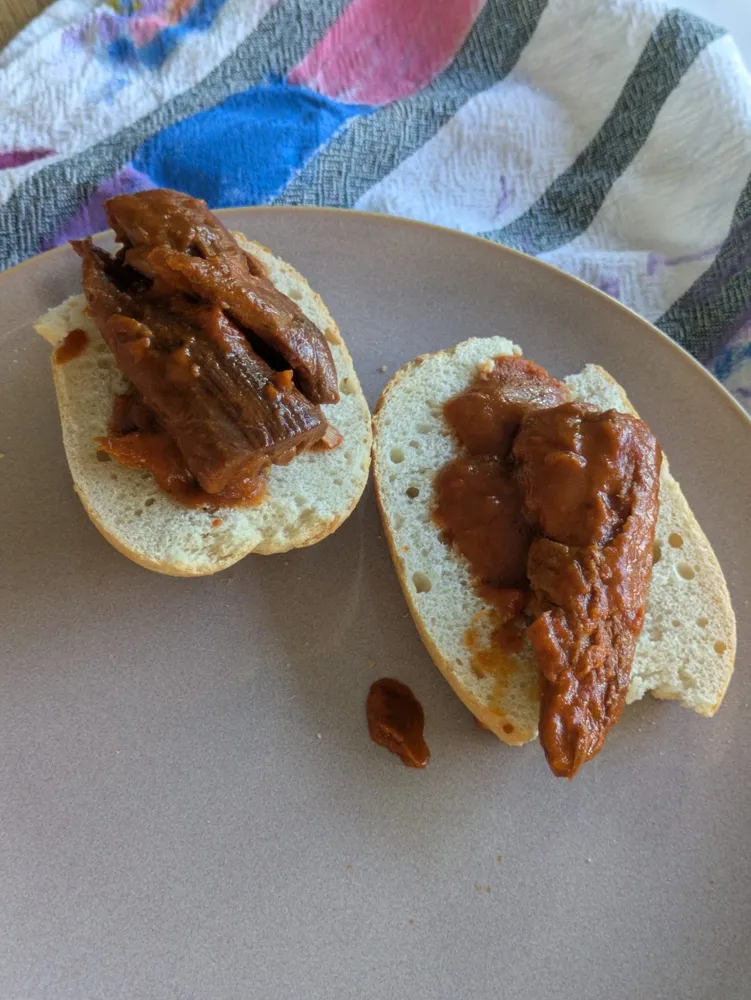
Logged 385 kcal and 25 g protein. AI alone: 380 kcal, 22 g. AI with food database: 380 kcal, 20 g.
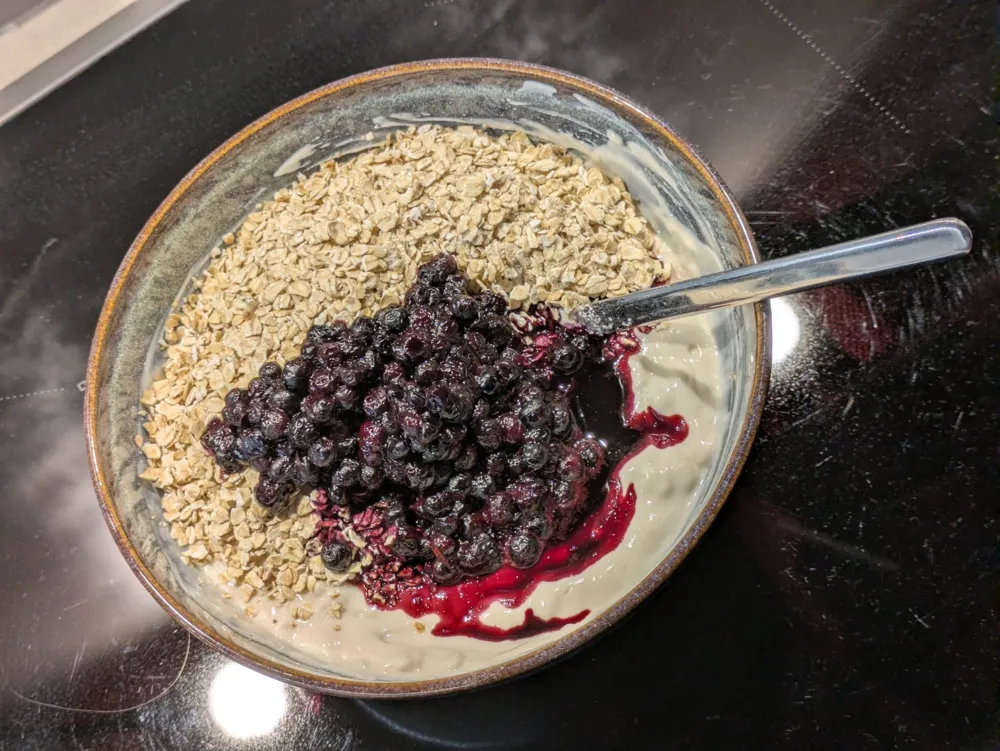
Logged 796 kcal and 59 g protein. AI alone: 370 kcal, 16 g. AI with food database: 356 kcal, 17 g.
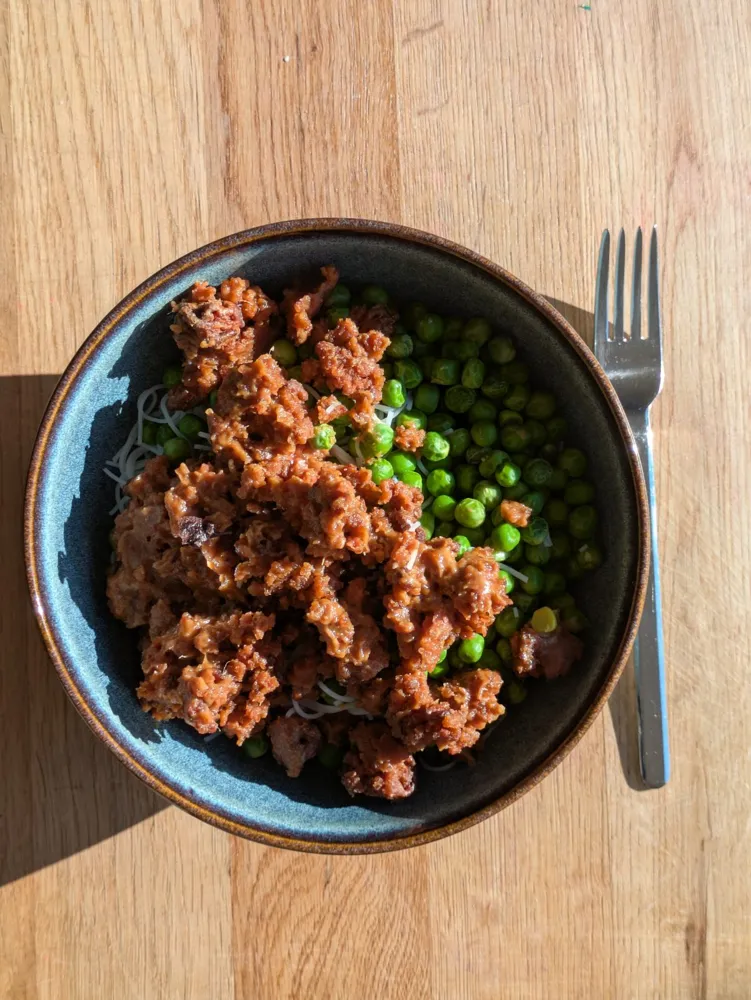
Logged 826 kcal and 48 g protein. AI alone: 430 kcal, 32 g. AI with food database: 325 kcal, 30 g.
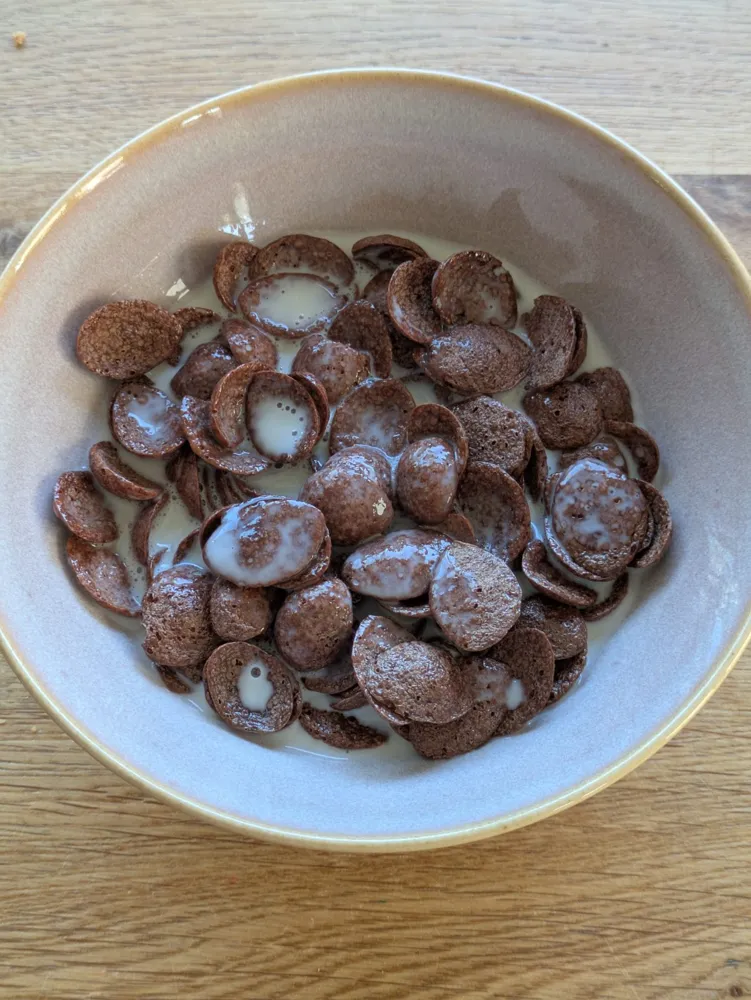
Logged 154 kcal and 8 g protein. AI alone: 320 kcal, 8 g. AI with food database: 245 kcal, 7 g.
Figure 2. Five of the 32 meals: two close estimates, two large misses and one overestimate.
If you track to follow a certain regime like high protein, which I think is most people who track, Claude Sonnet 5.5 significantly underestimates the protein that’s in there: by 17 g per meal on average (Table 1). That is also most of why it underestimates energy. It comes in about 100 kcal low per meal, and 17 g of protein is 68 kcal of that. Fat and carbs it gets about right on average. So yes, an estimate is better than nothing, by about 45 kcal per meal. But guessing my usual meal size gets within ±20 % just as often (Table 1).
Fiber is the one place where the food database clearly helps. Alone, the AI misses fiber by 5.1 g per meal and comes in 4.7 g low on average; with my database, the error drops to 4.4 g, and almost twice as many meals land within ±20 % (11 instead of 6).
If you’re in a cutting phase, trying to lose body fat, you’re running a deficit. At three meals a day, 100 kcal per meal adds up to about 300 kcal per day. That is a normal healthy deficit that you can sustain for a while, and it’s within the error margin these AIs give us.
My gut feeling is I’m going to keep tracking precisely with the kitchen scale, and I’m not going to defer to the AI.
More to explore
There are so many interesting things to explore here. 32 meals is very little, and I have more good data than I could use for experiments. One thing I’d find interesting: how does the way a given meal is presented affect the results? The same meal on a large plate or a small plate, in a large bowl or a small bowl. That goes in a different direction, because I’d need to prepare things in a specific way, or track over a long enough time that I happen to eat almost identical meals from different containers. Whenever I feel like there’s something I want to explore, I might turn this into a reasonably sized dataset.
Related work
There are larger meal datasets out there, of course. Noteworthy is Nutrition5k, 5 years old, with photos taken at Google cafeterias. Although the meals at Google are, in my experience, fantastic, they don’t quite hit the niche I am most interested in: home-made meals focused on fitness. And the dataset does not consider fiber, which I find particularly interesting. Then there is SNAPMe (over 3,000 photos), which does feature meals in the wild, but the accuracy of the nutrient values is unclear: they come from what participants reported in a diet-recall tool, with portions estimated rather than weighed. ACETADA seems very cool, and I should actually take a closer look at it, yet their meals are not home-made, and, again, they neglect fiber.
Then there are published studies, too, some of which use the datasets mentioned above. Li (2026) independently corroborates two of my findings, using Sonnet 5.5: energy underestimated by around 100 kcal per meal, with protein especially underestimated. Lo et al. (2023) try GPT-4V on ten meals from daily life, recorded with wearable cameras and weighed, and show similar findings: 151 kcal and 14 g of protein off per meal, against my 152 kcal and 18 g. Fridolfsson et al. (2025) find that both ChatGPT-4o and Claude 3.5 Sonnet underestimate more as portions get bigger, which is what my error bars in Figure 1 show. Two studies compare the two ways I tested. DietAI24 (2025) found that giving GPT-4 a food database lowered the error on Nutrition5k from 82 to 68 kcal per dish, though the difference in energy was not significant. Open-KNEAD (2026) found that a current model’s own estimate now matches or beats such a database pipeline. My numbers side with Open-KNEAD: 152 kcal off for the AI alone, 159 kcal with my food database.
| Dataset | Year | Size | Setting | Weighed | Fiber |
|---|---|---|---|---|---|
| Nutrition5k | 2021 | 5,006 plates | Google cafeterias | Yes | No |
| SNAPMe | 2022 | 3,311 photos, 95 people | Daily life, US | No, self-reported | Yes |
| ACETADA | 2025 | 806 photos, 152 adults | Controlled feeding | Yes | No |
| This post | 2026 | 32 meals | Home-made, daily life | Yes | Yes |
Table 2. Meal-photo datasets with nutrient labels, compared with the one in this post.
| Study | Data | Models | Finding |
|---|---|---|---|
| Li (2026), preprint | ACETADA, 802 meals | Claude Haiku, Sonnet and Opus 5.5; three GPT-6 models | Sonnet 5.5 −104 kcal per meal against energy served; protein underestimated by every model |
| Lo et al. (2023) | 10 meals, wearable cameras, weighed | GPT-4V | 151 kcal and 14 g protein mean error per meal |
| Fridolfsson et al. (2025) | 52 standardised photos, weighed, three portion sizes | ChatGPT-4o, Claude 3.5 Sonnet, Gemini 1.5 Pro | Large portions underestimated; energy off by 36 % for ChatGPT and Claude |
| DietAI24 (2025) | Nutrition5k, 1,000 dishes | GPT-4 Vision, alone and with a food database | 82 kcal alone, 68 kcal with the database; energy difference not significant |
| Open-KNEAD (2026) | Nutrition5k, OmniFood8K, ACETADA | Several open and commercial models | A model’s own estimate matches or beats a database pipeline |
| This post | 32 home meals, weighed | Claude Sonnet 5.5, alone and with a food database | 152 kcal and 17.9 g protein mean error; −101 kcal and −17 g bias |
Table 3. Studies of general-purpose models estimating nutrients from meal photos.